Discrete Color and Fill Scales for evanverse Palettes
Source:R/scale_evanverse_discrete.R
scale_evanverse.RdApply evanverse color palettes to ggplot2 discrete scales. These functions provide a seamless integration between evanverse palettes and ggplot2's color/fill aesthetics.
Usage
scale_color_evanverse(
  palette,
  type = NULL,
  n = NULL,
  reverse = FALSE,
  na.value = "grey50",
  guide = "legend",
  ...
)

scale_fill_evanverse(
  palette,
  type = NULL,
  n = NULL,
  reverse = FALSE,
  na.value = "grey50",
  guide = "legend",
  ...
)

scale_colour_evanverse(
  palette,
  type = NULL,
  n = NULL,
  reverse = FALSE,
  na.value = "grey50",
  guide = "legend",
  ...
)
Arguments
- palette
Character. Name of the palette (e.g., "qual_vivid", "seq_blues"). Type will be automatically inferred from the prefix if not specified.
- type
Character. Palette type: "sequential", "diverging", or "qualitative". If
NULL(default), the type is automatically inferred from the palette name prefix.- n
Integer. Number of colors to use. If
NULL(default), all colors from the palette are used. Ifnexceeds the number of colors in the palette, an error will be raised.- reverse
Logical. Should the color order be reversed? Default is
FALSE.- na.value
Character. Color to use for
NAvalues. Default is "grey50".- guide
Character or function. Type of legend. Use "legend" for standard legend or "none" to hide the legend. See
guide_legendfor more options.- ...
Additional arguments passed to
scale_color_manualorscale_fill_manual, such asname,labels,limits, etc.
Details
The scale_color_evanverse() and scale_fill_evanverse()
functions automatically:
Infer palette type from the naming convention (seq_, div_, qual_)
Handle color interpolation intelligently based on palette type:
Qualitative palettes: Direct color selection (no interpolation)
Sequential/Diverging palettes: Smooth interpolation when n < palette size
Support all standard ggplot2 scale parameters
Provide informative error messages and warnings
See also
get_palette for retrieving palette colors,
list_palettes for available palettes,
scale_color_manual for the underlying ggplot2 function.
Examples
library(ggplot2)
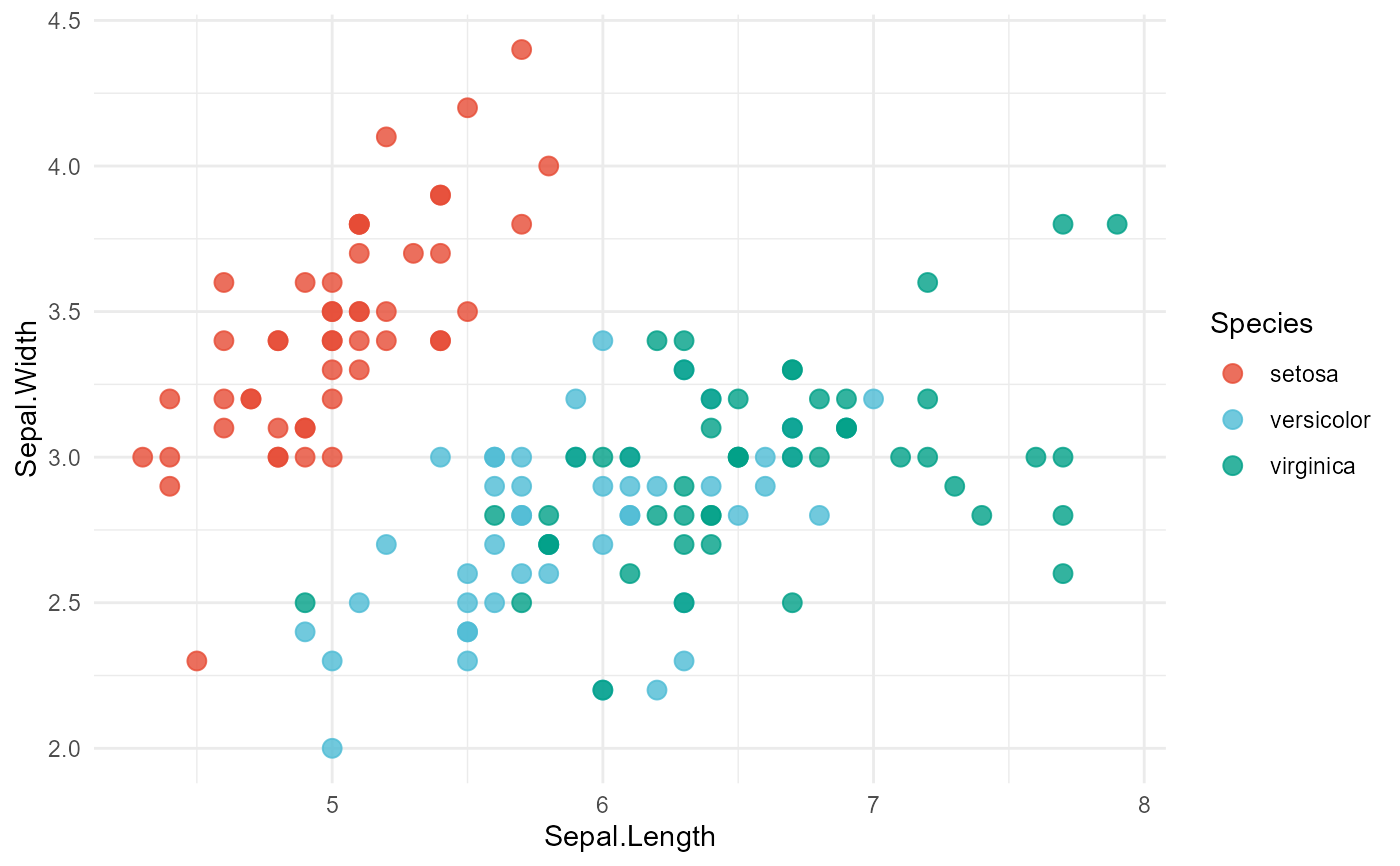
# Basic usage with automatic type inference
ggplot(iris, aes(Sepal.Length, Sepal.Width, color = Species)) +
geom_point(size = 3, alpha = 0.8) +
scale_color_evanverse("qual_vivid") +
theme_minimal()
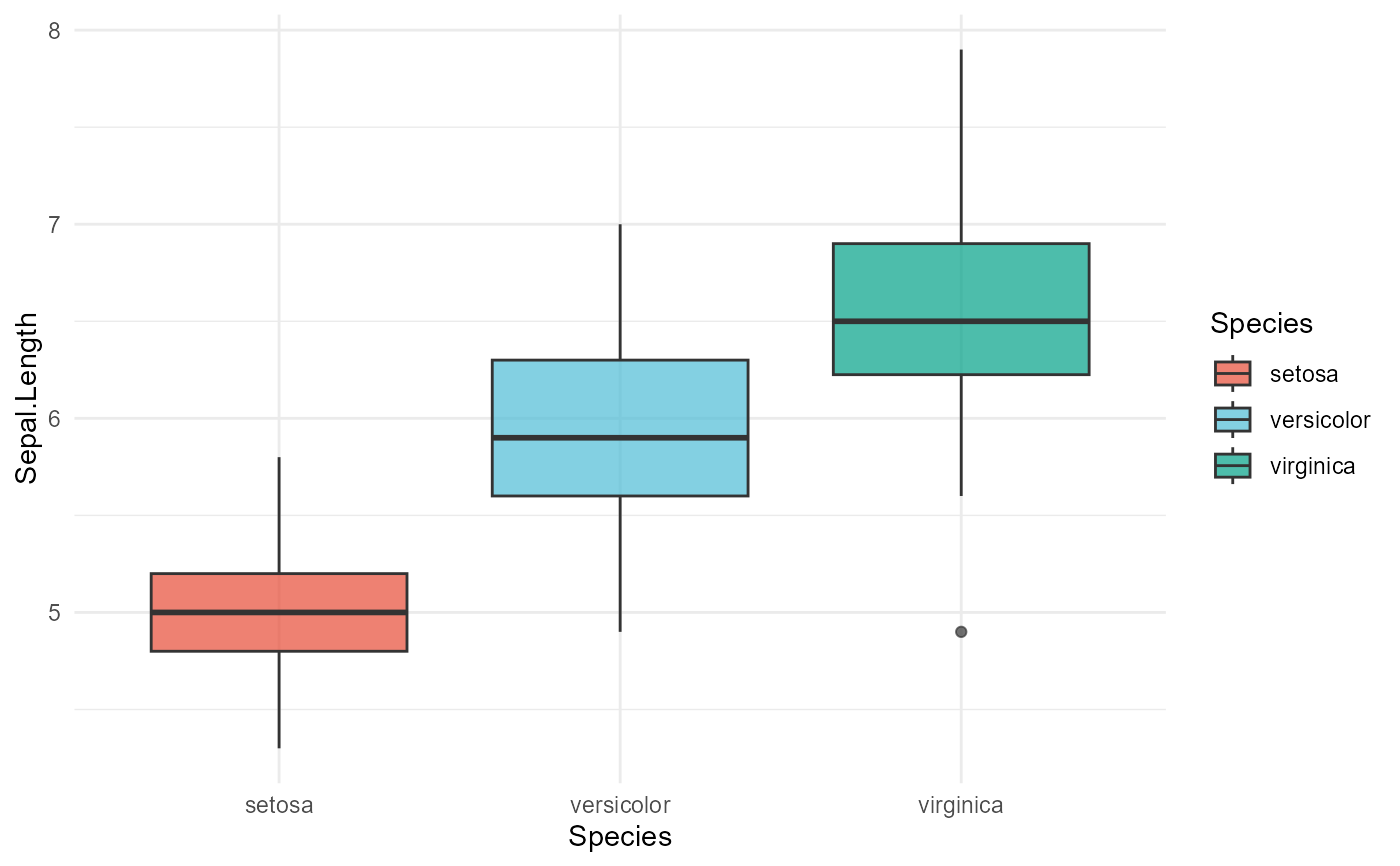
 # Fill scale for boxplots
ggplot(iris, aes(x = Species, y = Sepal.Length, fill = Species)) +
geom_boxplot(alpha = 0.7) +
scale_fill_evanverse("qual_vivid") +
theme_minimal()
# Fill scale for boxplots
ggplot(iris, aes(x = Species, y = Sepal.Length, fill = Species)) +
geom_boxplot(alpha = 0.7) +
scale_fill_evanverse("qual_vivid") +
theme_minimal()
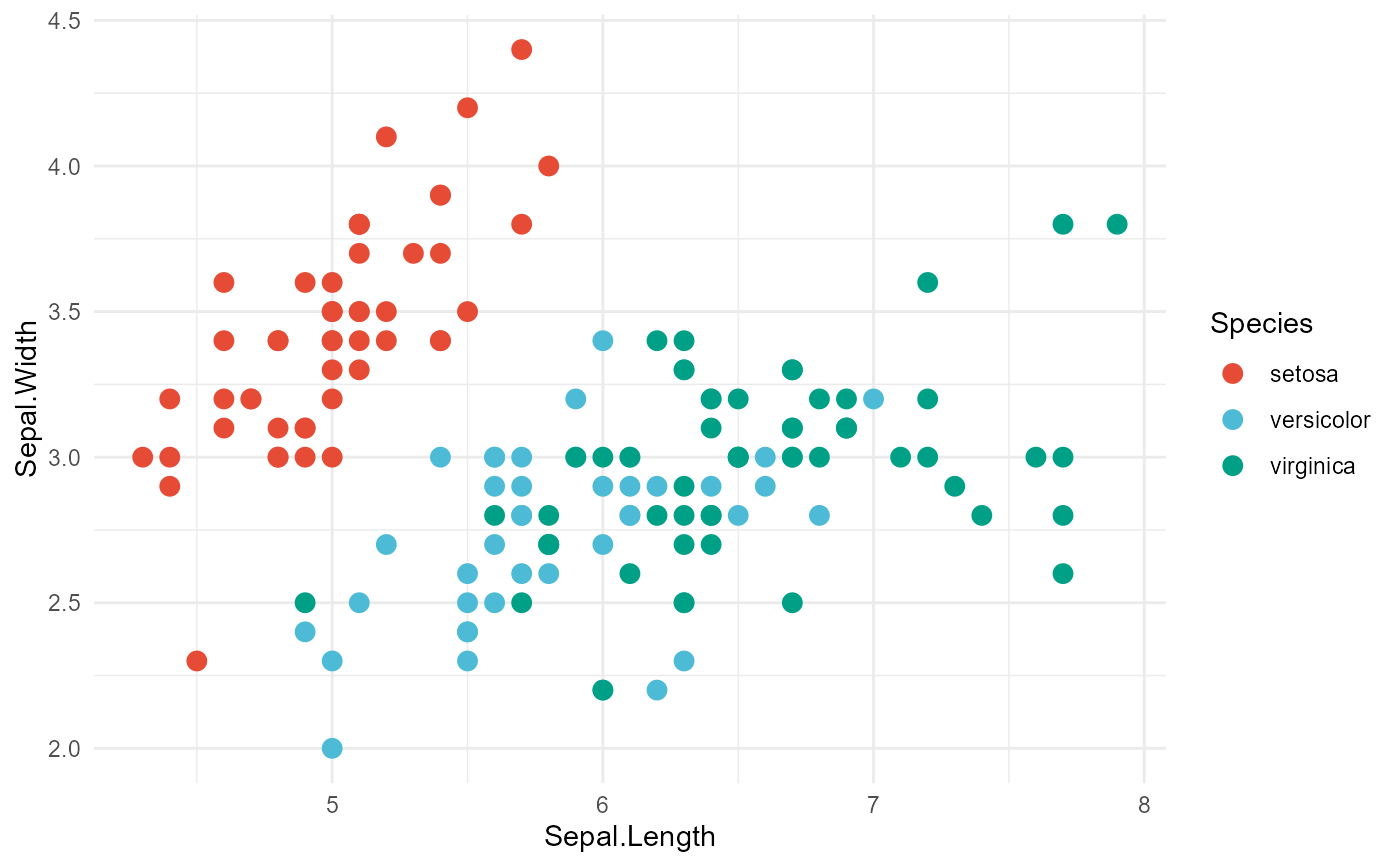
 # Reverse color order
ggplot(iris, aes(Sepal.Length, Sepal.Width, color = Species)) +
geom_point(size = 3) +
scale_color_evanverse("qual_vivid", reverse = TRUE) +
theme_minimal()
# Reverse color order
ggplot(iris, aes(Sepal.Length, Sepal.Width, color = Species)) +
geom_point(size = 3) +
scale_color_evanverse("qual_vivid", reverse = TRUE) +
theme_minimal()
 # Explicitly specify type
ggplot(iris, aes(Sepal.Length, Sepal.Width, color = Species)) +
geom_point(size = 3) +
scale_color_evanverse("qual_vivid", type = "qualitative") +
theme_minimal()
# Explicitly specify type
ggplot(iris, aes(Sepal.Length, Sepal.Width, color = Species)) +
geom_point(size = 3) +
scale_color_evanverse("qual_vivid", type = "qualitative") +
theme_minimal()
 # Limit number of colors
ggplot(iris, aes(Sepal.Length, Sepal.Width, color = Species)) +
geom_point(size = 3) +
scale_color_evanverse("qual_vivid", n = 3) +
theme_minimal()
# Limit number of colors
ggplot(iris, aes(Sepal.Length, Sepal.Width, color = Species)) +
geom_point(size = 3) +
scale_color_evanverse("qual_vivid", n = 3) +
theme_minimal()
 # Custom legend name and labels
ggplot(iris, aes(Sepal.Length, Sepal.Width, color = Species)) +
geom_point(size = 3) +
scale_color_evanverse(
"qual_vivid",
name = "Iris Species",
labels = c("Setosa", "Versicolor", "Virginica")
) +
theme_minimal()
# Custom legend name and labels
ggplot(iris, aes(Sepal.Length, Sepal.Width, color = Species)) +
geom_point(size = 3) +
scale_color_evanverse(
"qual_vivid",
name = "Iris Species",
labels = c("Setosa", "Versicolor", "Virginica")
) +
theme_minimal()
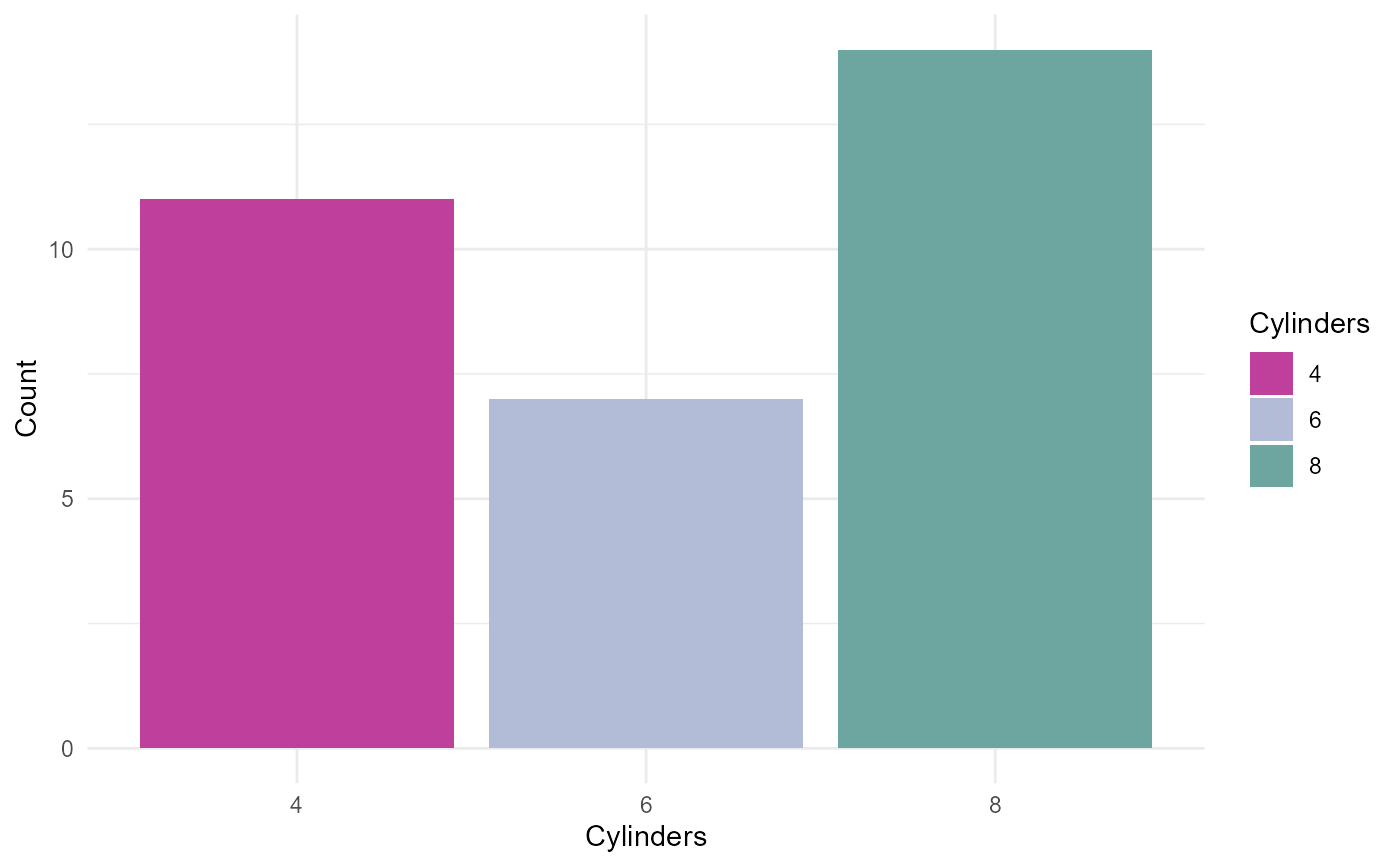
 # Bar plot with fill
ggplot(mtcars, aes(x = factor(cyl), fill = factor(cyl))) +
geom_bar() +
scale_fill_evanverse("qual_vibrant") +
labs(x = "Cylinders", y = "Count", fill = "Cylinders") +
theme_minimal()
# Bar plot with fill
ggplot(mtcars, aes(x = factor(cyl), fill = factor(cyl))) +
geom_bar() +
scale_fill_evanverse("qual_vibrant") +
labs(x = "Cylinders", y = "Count", fill = "Cylinders") +
theme_minimal()