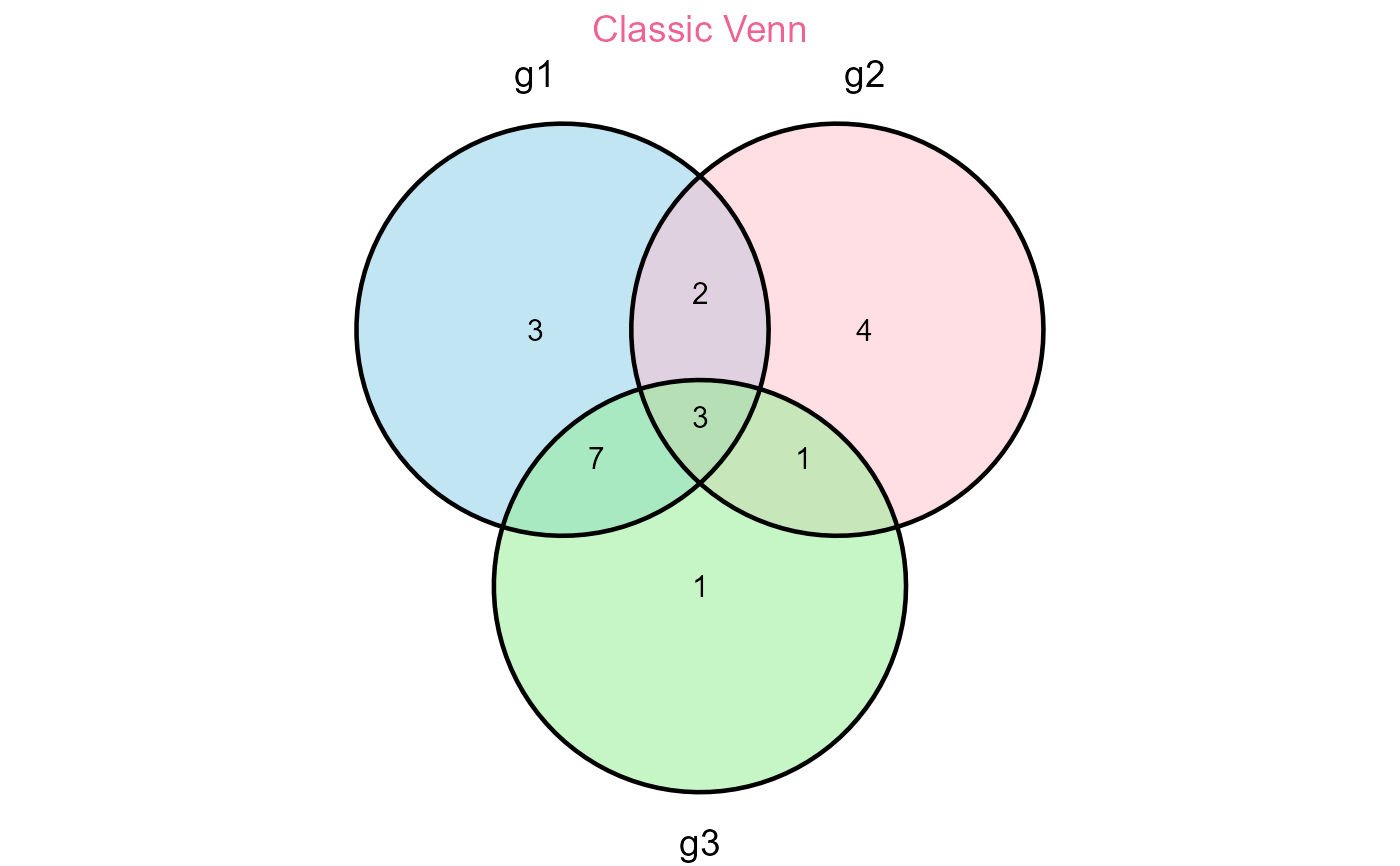
A flexible and unified Venn diagram plotting function supporting both ggvenn
and ggVennDiagram
. Automatically handles naming, de-duplication, and visualization.
Usage
plot_venn(
set1,
set2,
set3 = NULL,
set4 = NULL,
category.names = NULL,
fill = c("skyblue", "pink", "lightgreen", "lightyellow"),
label = "count",
label_geom = "label",
label_alpha = 0,
fill_alpha = 0.5,
label_size = 4,
label_color = "black",
set_color = "black",
set_size = 5,
edge_lty = "solid",
edge_size = 0.8,
title = "My Venn Diagram",
title_size = 14,
title_color = "#F06292",
legend.position = "none",
method = c("classic", "gradient"),
digits = 1,
label_sep = ",",
show_outside = "auto",
auto_scale = FALSE,
palette = "Spectral",
direction = 1,
preview = TRUE,
return_sets = FALSE,
...
)
Arguments
- set1, set2, set3, set4
Input vectors. At least two sets are required.
- category.names
Optional vector of set names. If NULL, variable names are used.
- fill
Fill colors (for
method = "classic"
).- label
Label type:
"count"
,"percent"
,"both"
, or"none"
.- label_geom
Label geometry for
ggVennDiagram
:"label"
or"text"
.- label_alpha
Background transparency for labels (only for
gradient
).- fill_alpha
Transparency for filled regions (only for
classic
).- label_size
Size of region labels.
- label_color
Color of region labels.
- set_color
Color of set labels and borders.
- set_size
Font size for set names.
- edge_lty
Line type for borders.
- edge_size
Border thickness.
- title
Plot title.
- title_size
Title font size.
- title_color
Title font color.
- legend.position
Legend position. Default:
"none"
.- method
Drawing method:
"classic"
(ggvenn) or"gradient"
(ggVennDiagram).- digits
Decimal places for percentages (classic only).
- label_sep
Separator for overlapping elements (classic only).
- show_outside
Show outside elements (classic only).
- auto_scale
Whether to auto-scale layout (classic only).
- palette
Gradient palette name (gradient only).
- direction
Palette direction (gradient only).
- preview
Whether to print the plot to screen.
- return_sets
If TRUE, returns a list of de-duplicated input sets.
- ...
Additional arguments passed to the underlying plot function.
Examples
set.seed(123)
g1 <- sample(letters, 15)
g2 <- sample(letters, 10)
g3 <- sample(letters, 12)
# Classic 3-set Venn
plot_venn(g1, g2, g3, method = "classic", title = "Classic Venn")
# Gradient 2-set Venn
plot_venn(g1, g2, method = "gradient", title = "Gradient Venn")
# Return sets for downstream use
out <- plot_venn(g1, g2, return_sets = TRUE)
names(out)
#> [1] "plot" "sets"