Accepts a character/factor vector (frequency counted automatically), a named numeric vector of pre-computed counts, or a data frame with pre-computed counts. Slices with zero count are dropped. At least two groups are required.
Usage
plot_pie(
  data,
  group_col = NULL,
  count_col = NULL,
  label = c("none", "count", "percent", "both"),
  palette = NULL
)
Arguments
- data
A character/factor vector, named numeric vector, or data.frame.
- group_col
Character. Column name for group labels (data.frame only).
- count_col
Character. Column name for counts (data.frame only). Values must be non-negative.
- label
Label type:
"none","count","percent", or"both". Default:"none".- palette
Character vector or
NULL. Slice fill colors recycled to match the number of groups. IfNULL, uses ggplot2 default colors. Default:NULL.
Examples
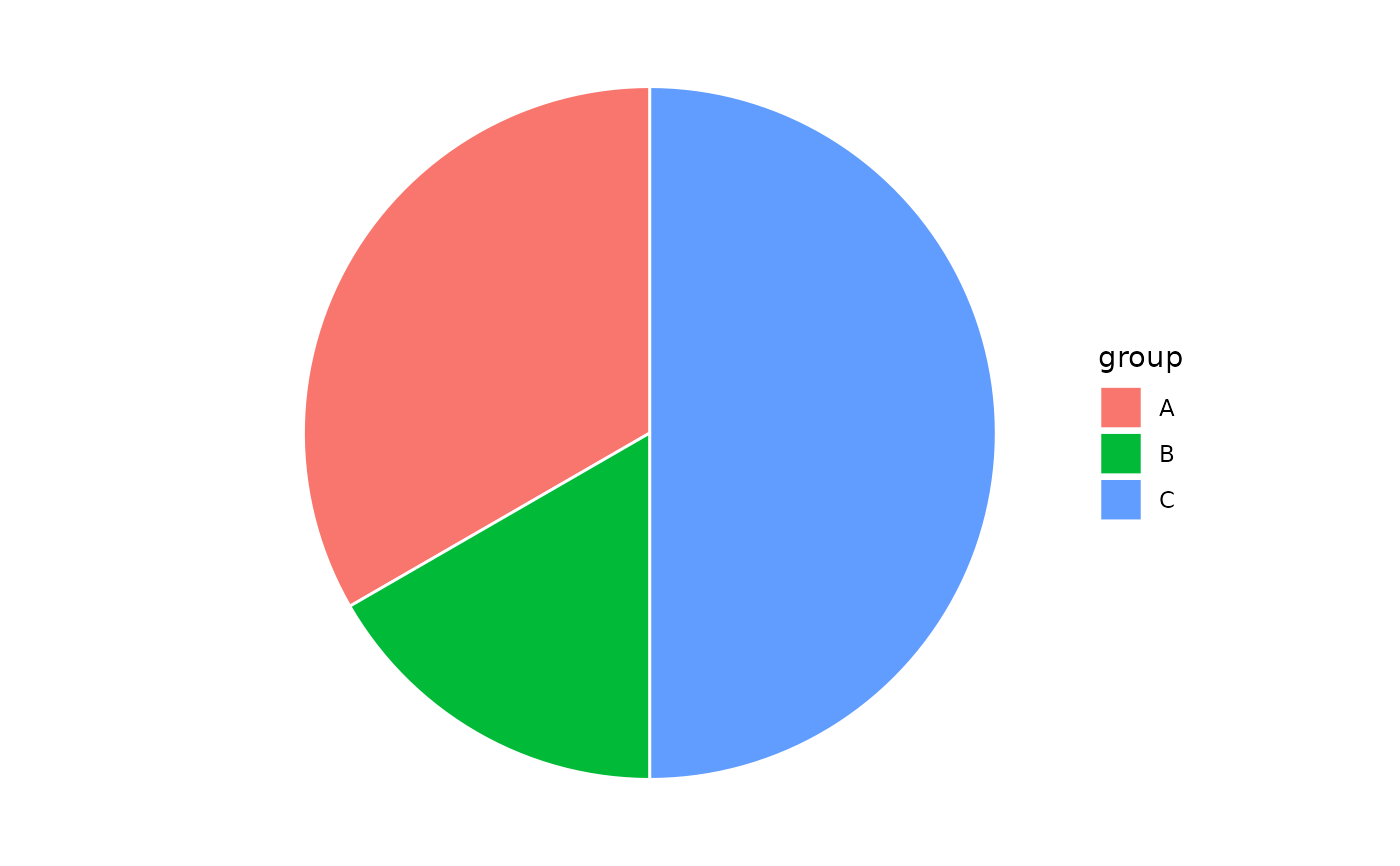
# From a vector
plot_pie(c("A", "A", "B", "C", "C", "C"))
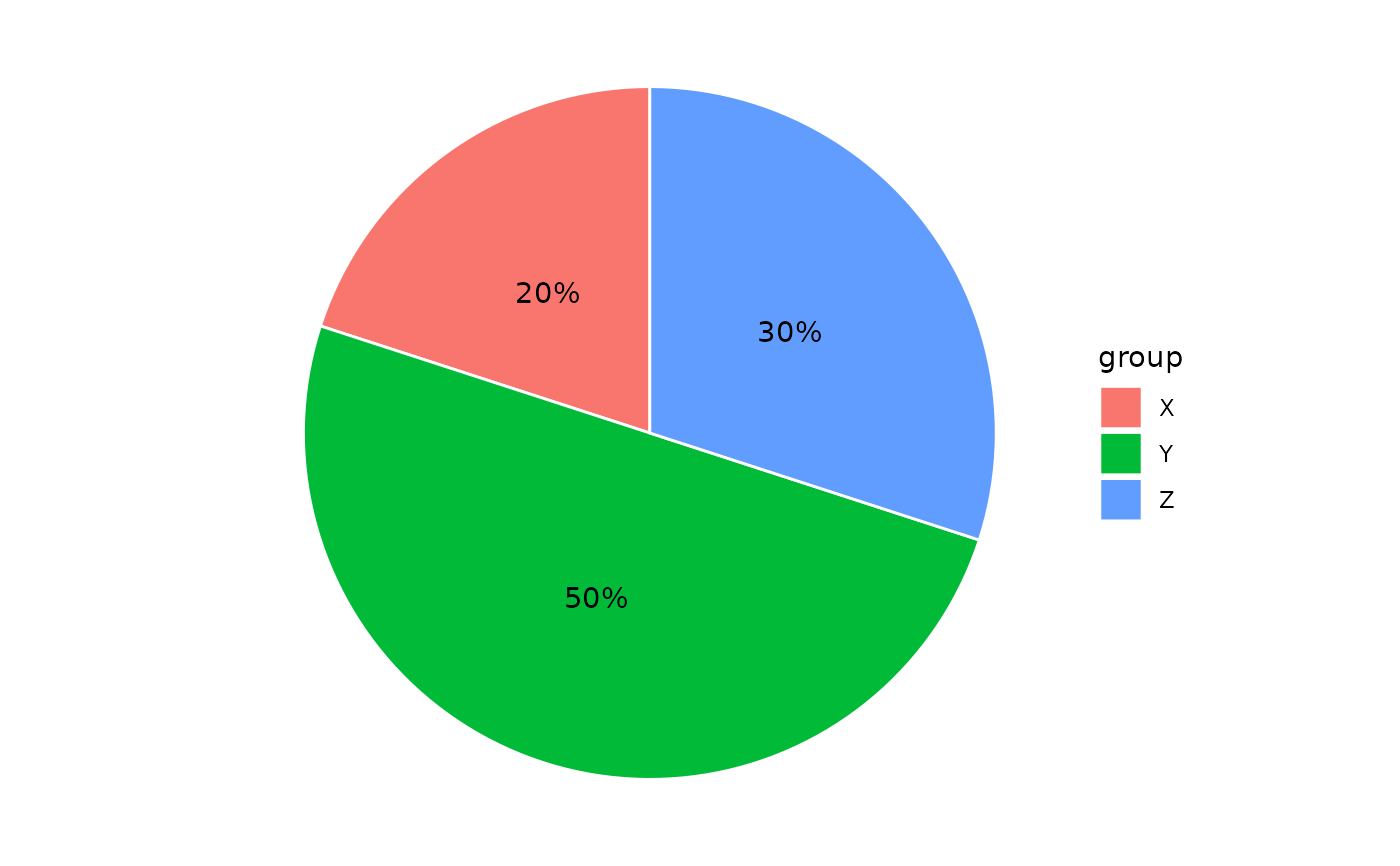
 # From a data frame
df <- data.frame(group = c("X", "Y", "Z"), count = c(10, 25, 15))
plot_pie(df, group_col = "group", count_col = "count", label = "percent")
# From a data frame
df <- data.frame(group = c("X", "Y", "Z"), count = c(10, 25, 15))
plot_pie(df, group_col = "group", count_col = "count", label = "percent")