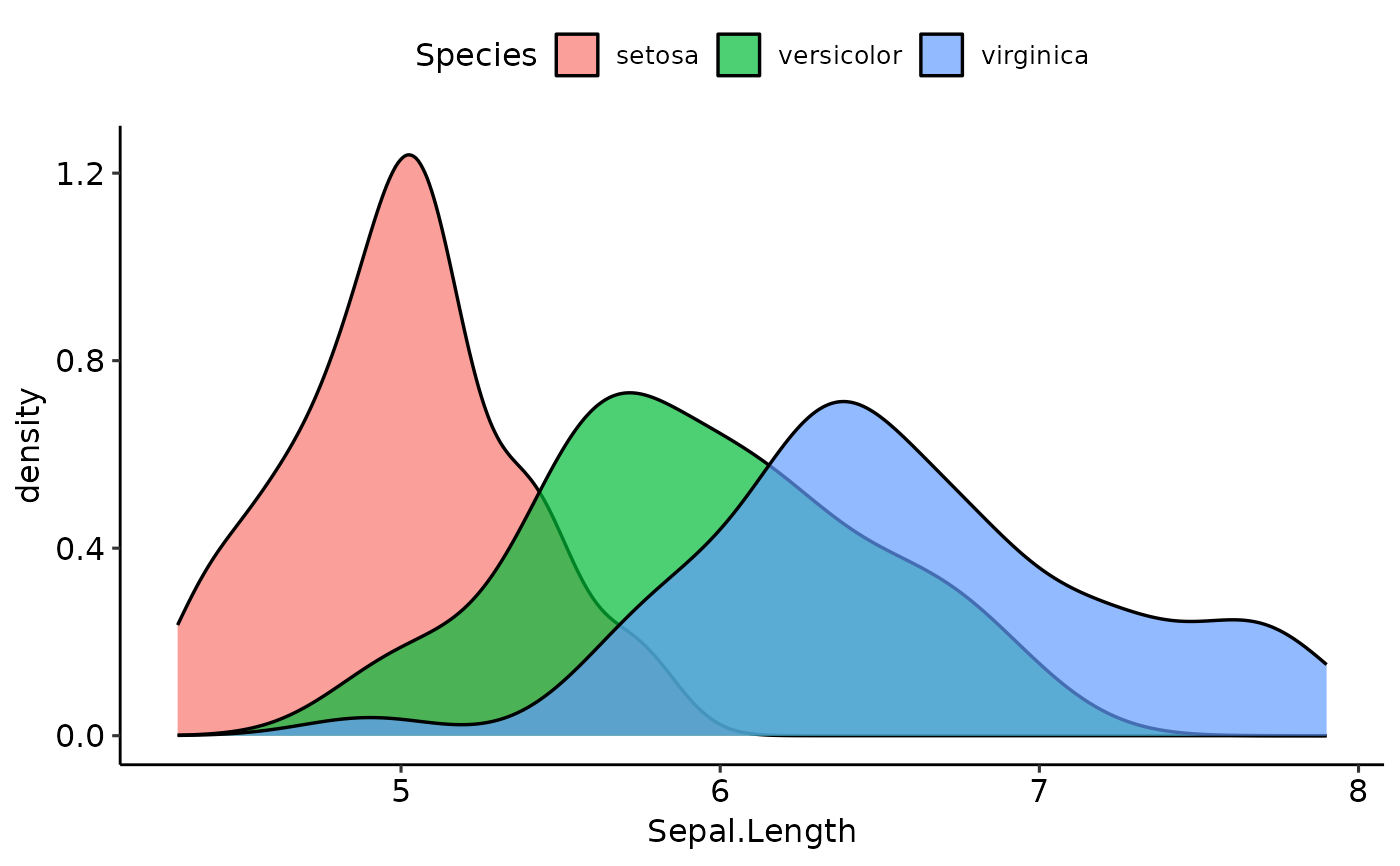
Create a univariate density plot with optional fill grouping and faceting.
Density curves have a fixed black border; fill is controlled by group_col.
Usage
plot_density(
  data,
  x_col,
  group_col = NULL,
  facet_col = NULL,
  alpha = 0.7,
  adjust = 1,
  palette = NULL
)
Arguments
- data
A data.frame.
- x_col
Character. Column name of the numeric variable to plot.
- group_col
Character or
NULL. Column name for fill grouping. Default:NULL.- facet_col
Character or
NULL. Column name for faceting. Default:NULL.- alpha
Numeric. Fill transparency [0, 1] (0 = fully transparent, 1 = fully opaque). Default: 0.7.
- adjust
Numeric. Bandwidth adjustment multiplier. Default: 1.
- palette
Character vector or
NULL. Fill colors recycled to match the number of groups. IfNULL, uses ggplot2 default colors. Default:NULL.