Create a bar chart from a data frame with optional dodge grouping, vertical/horizontal orientation, and sorting by y values.
Usage
plot_bar(
  data,
  x_col,
  y_col,
  horizontal = FALSE,
  sort = FALSE,
  decreasing = TRUE,
  group_col = NULL,
  sort_by = NULL
)
Arguments
- data
A data.frame.
- x_col
Character. Column name for the x-axis. Values must be unique when
group_colisNULL.- y_col
Character. Column name for the y-axis.
- horizontal
Logical. If
TRUE, flip to horizontal layout. Default:FALSE.- sort
Logical. Whether to sort bars by y values. Default:
FALSE.- decreasing
Logical. If
sort = TRUE, sort in decreasing order. Default:TRUE.- group_col
Character or
NULL. Column name for dodge grouping. Default:NULL.- sort_by
Character or
NULL. Required whensort = TRUEandgroup_colis set. Must be a valid level of thegroup_colcolumn; used to order x positions by that group's y values.
Examples
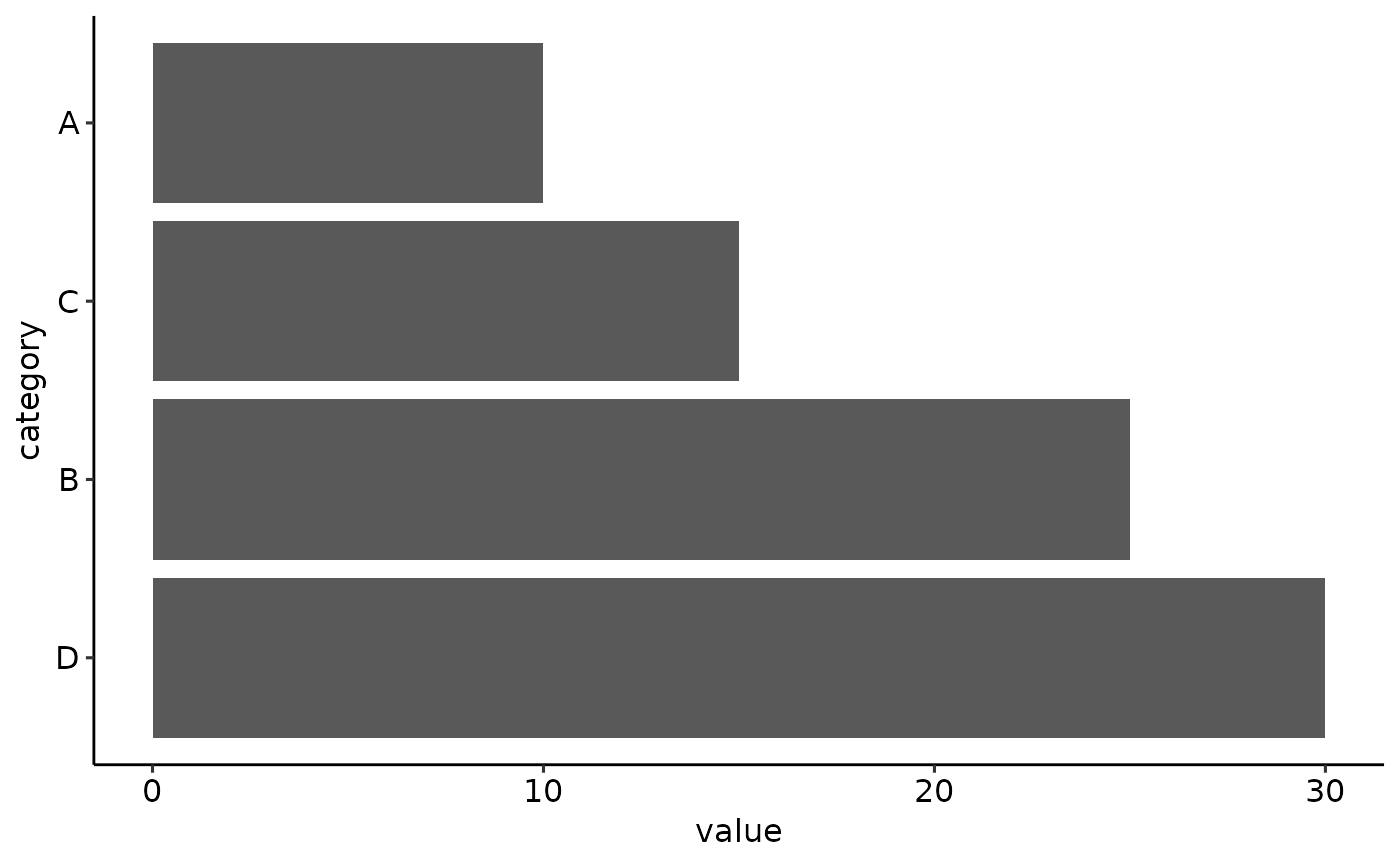
df <- data.frame(
  category = c("A", "B", "C", "D"),
  value    = c(10, 25, 15, 30)
)
plot_bar(df, x_col = "category", y_col = "value",
         sort = TRUE, horizontal = TRUE)