
Image-Inspired Color Palettes for Biomedical Visualization


[!NOTE] 🎉 biopalette is on CRAN.
install.packages("biopalette")installs the current release, 0.2.2.
Overview
biopalette is an R package providing image-inspired color palettes for biomedical visualization.
Every palette begins with a real image — a film still, a scientific figure, an artwork — and is translated into a reproducible color system. The source is always documented: where the colors came from, what they mean, and when to use them.
Installation
# Current CRAN release
install.packages("biopalette")

# Development version
remotes::install_github("evanbio/biopalette")
Quick Start
library(biopalette)

get_palette("babel", n = 5)
get_palette("three_body")
get_palette("walter_white", type = "diverging")

preview_palette("gene_red")
palette_gallery()

scale_color_biopalette("three_body")
scale_fill_biopalette_gradient("mitonuclear_blue")
Palettes
| Name | Type | Colors | Recommended use | Source |
|---|---|---|---|---|
gene_red |
Qualitative | 2 | Emphasized signal versus a dark or neutral counterpart | Better Call Saul — Gene Takavic’s red coat |
walter_white |
Diverging | 5 | Signed continuous values around a neutral center | Breaking Bad — desert to sky |
walter_white2 |
Qualitative | 5 | Up to five unordered groups | Breaking Bad — muted earth tones |
walter_white3 |
Diverging | 5 | Warm-register signed continuous values | Breaking Bad — warm counterpart |
babel |
Qualitative | 21 | Many categorical groups with labels or position support | Pan-cancer myeloid atlas (Cell, 2021) |
bcell_atlas |
Qualitative | 7 | Four-to-seven categorical groups with direct labels or position support | Pan-cancer B-cell atlas (Cell, 2024) — graphical abstract |
bcell_atlas2 |
Diverging | 5 | Signed change between warm and cool biological states | Pan-cancer B-cell atlas (Cell, 2024) — IgA to IgG shift |
bcell_clusters |
Qualitative | 20 | Many labeled categorical groups with position or faceting support | Pan-cancer B-cell atlas (Cell, 2024) — Figure 1B cluster legend |
three_body |
Qualitative | 3 | Three groups, lineages, or trajectories | Pan-cancer myeloid atlas (Cell, 2021) |
heat_light |
Qualitative | 2 | Paired categories or experimental conditions | Bond ampholysis (Nature, 2024) |
tam_pastel |
Qualitative | 6 | Four-to-six categorical groups on light backgrounds | Pan-cancer myeloid atlas (Cell, 2021) |
cancer_mosaic |
Qualitative | 15 | Ten-to-fifteen categories with labels or position support | Pan-cancer myeloid atlas (Cell, 2021) |
lactate_steps |
Qualitative | 5 | Five discrete workflow stages or study groups | Lactate metabolism and immunotherapy (JECCR, 2024) |
mitonuclear_blue |
Sequential | 6 | Cool low-to-high continuous values | Mito-nuclear communication in aging (TIBS, 2022) — young blue |
mitonuclear_orange |
Sequential | 6 | Warm low-to-high continuous values | Mito-nuclear communication in aging (TIBS, 2022) — aged orange |
fargo |
Qualitative | 3 | Three groups with a dark anchor and restrained warm accent | Fargo — navy, motel-sign teal, and suitcase wine |
immune_circuit |
Qualitative | 8 | Four parent groups with paired states | Chondrosarcoma immune-circuit graphical abstract |
immune_circuit_red |
Sequential | 7 | Increasing tumor burden, cytotoxicity, risk, or damage | Chondrosarcoma immune-circuit graphical abstract — tumor coral |
immune_circuit_green |
Sequential | 7 | Increasing immune activation, infiltration, or recovery | Chondrosarcoma immune-circuit graphical abstract — T-cell mint |
lipid_budding |
Qualitative | 4 | Four categorical groups with a balanced cool–warm structure | Hepatic ER lipid-droplet budding — DGAT2, DGAT1, Seipin, and FIT2 |
lipid_budding_blue |
Sequential | 5 | Low-to-high continuous values in muted steel blue | Hepatic ER lipid-droplet budding — DGAT2 blue |
lipid_budding_rose |
Sequential | 5 | Low-to-high continuous values in dusty rose | Hepatic ER lipid-droplet budding — DGAT1 rose |
lipid_budding_orange |
Sequential | 5 | Low-to-high continuous values in salmon orange | Hepatic ER lipid-droplet budding — Seipin orange |
lipid_budding_indigo |
Sequential | 5 | Low-to-high continuous values in slate indigo | Hepatic ER lipid-droplet budding — FIT2 indigo |
cytokine_sensors |
Qualitative | 7 | Six neuroimmune outcomes with a neutral cytokine anchor | Neuronal cytokine sensing in the CNS (Trends Immunology, 2026) |
clone_age |
Diverging | 5 | Age- and state-related change around a neutral center | Clonal hematopoiesis — mutant-clone yellow to HSC purple |
clone_memory |
Diverging | 5 | Stimulation, recovery, and clone-state contrasts | Epigenetic HSC memory — activated purple to pre-existing cyan |
ppi_obligate |
Qualitative | 4 | Four members of one assembled complex or system | Obligate protein interactions — blue-violet, purple, green, and yellow |
ppi_nonspecific |
Qualitative | 2 | Two interaction partners, conditions, or cohorts | Non-specific protein interactions — purple and green |
ppi_transient |
Diverging | 5 | Centered interaction scores and signed effects | Transient protein interactions — red through neutral to blue |
Function Areas
| Area | Functions |
|---|---|
| Palette access |
get_palette(), palette_info(), list_palettes(), palette_gallery()
|
| Palette management |
create_palette(), remove_palette(), preview_palette()
|
| ggplot2 scales |
scale_color_biopalette(), scale_fill_biopalette(), and gradient variants |
| Color utilities |
hex2rgb(), rgb2hex()
|
From Palette to Figure
biopalette provides the R interface for retrieving and applying image-inspired palettes. Tessera documents their source images, example data, and reproducible R figure recipes. Palette Lab keeps the data and graphical structure fixed while comparing palette behavior across 17 graphical contexts.
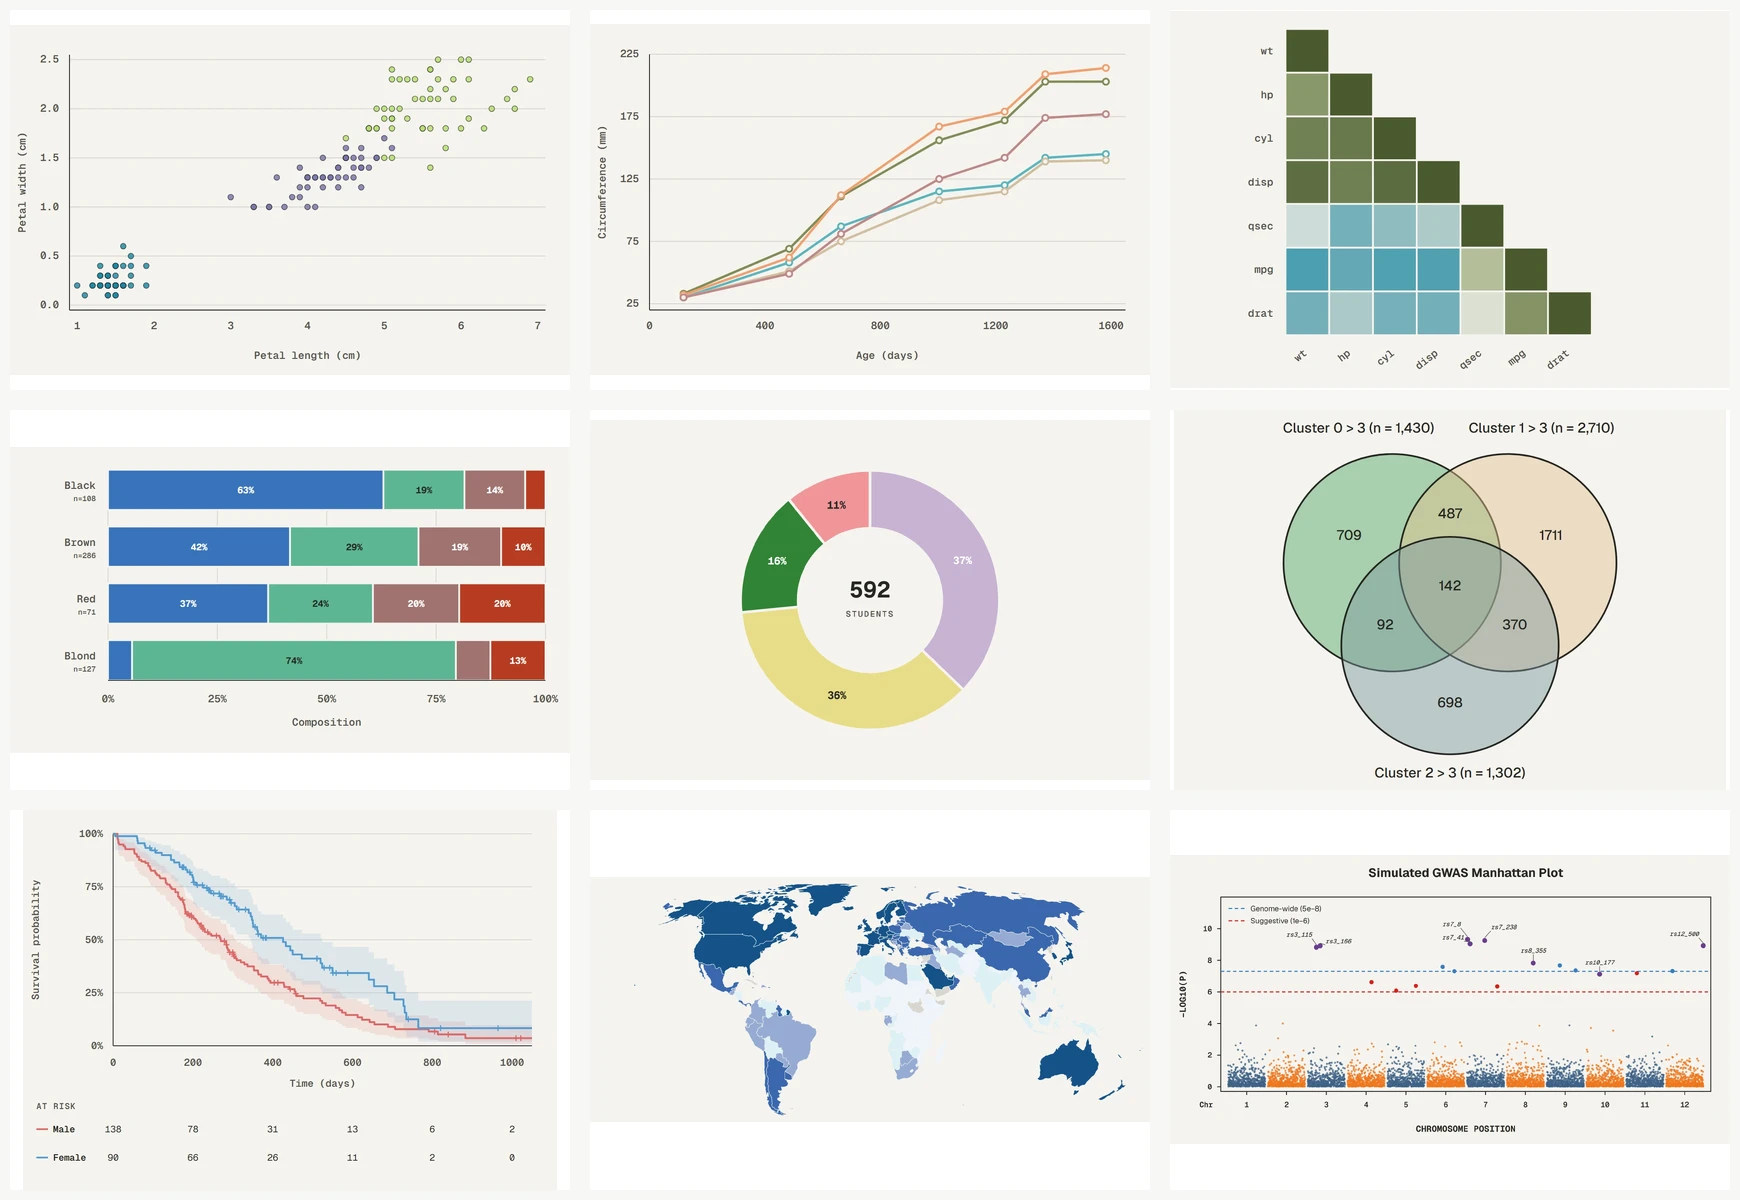
The panels below are rendered from Palette Lab with fixed data and figure structure. Each Tessera link provides the corresponding reproducible figure recipe and data context.
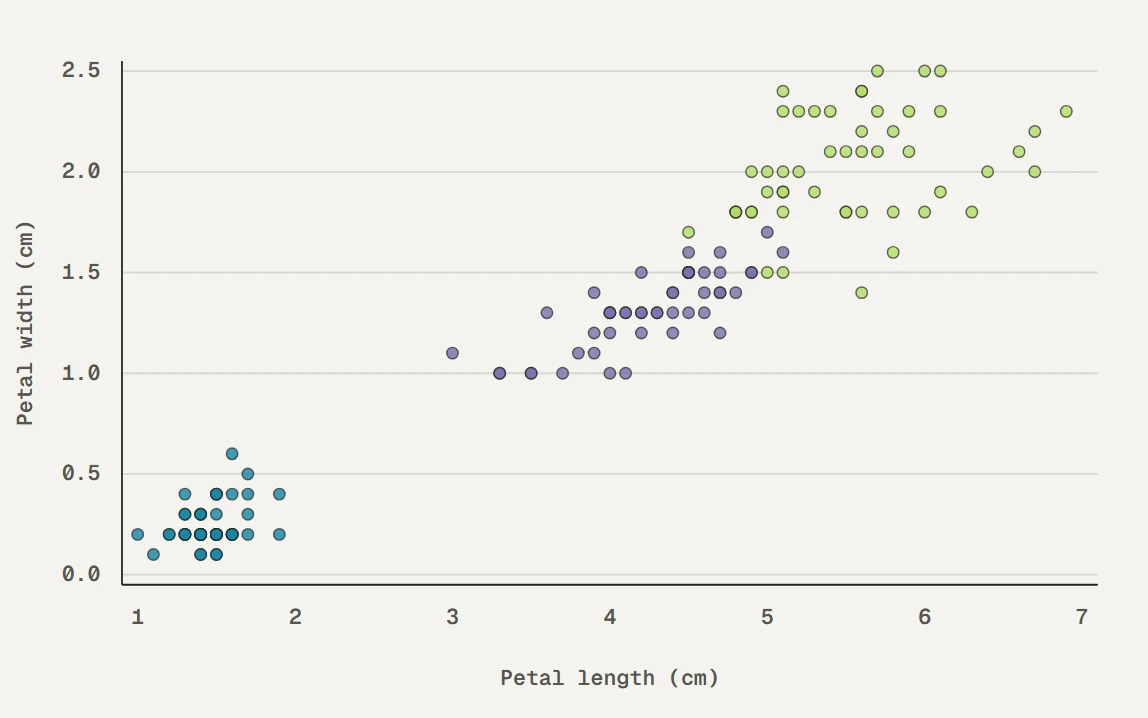 Grouped scatter · babel
|
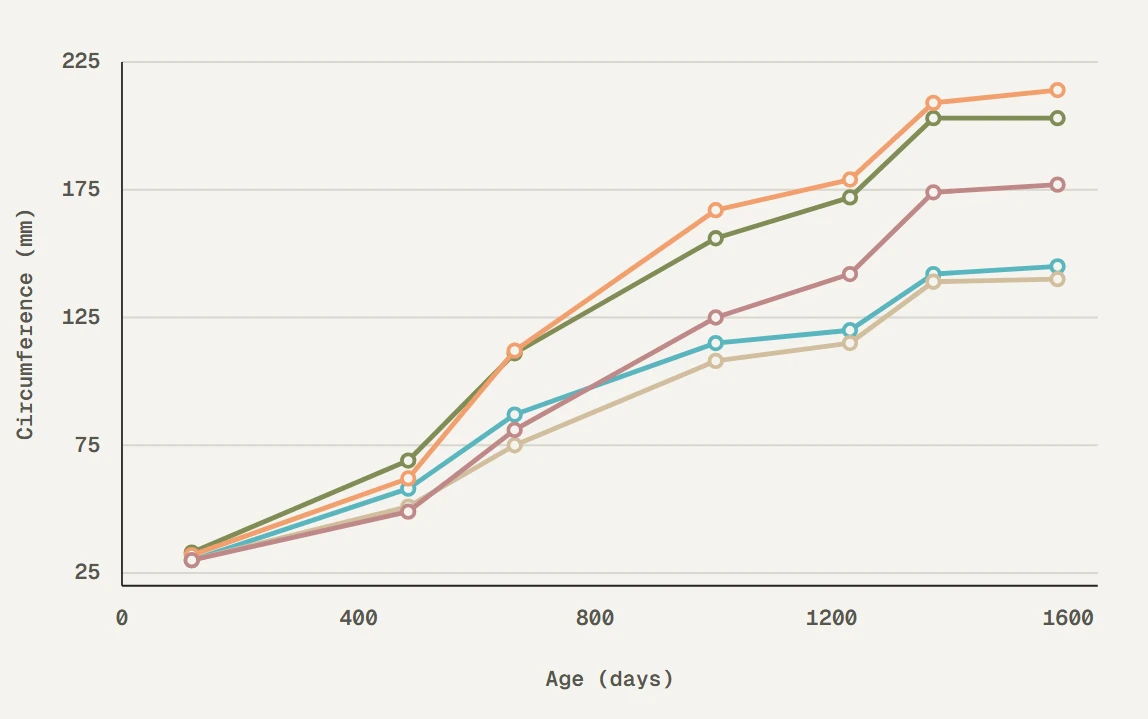 Multi-line comparison · walter_white2
|
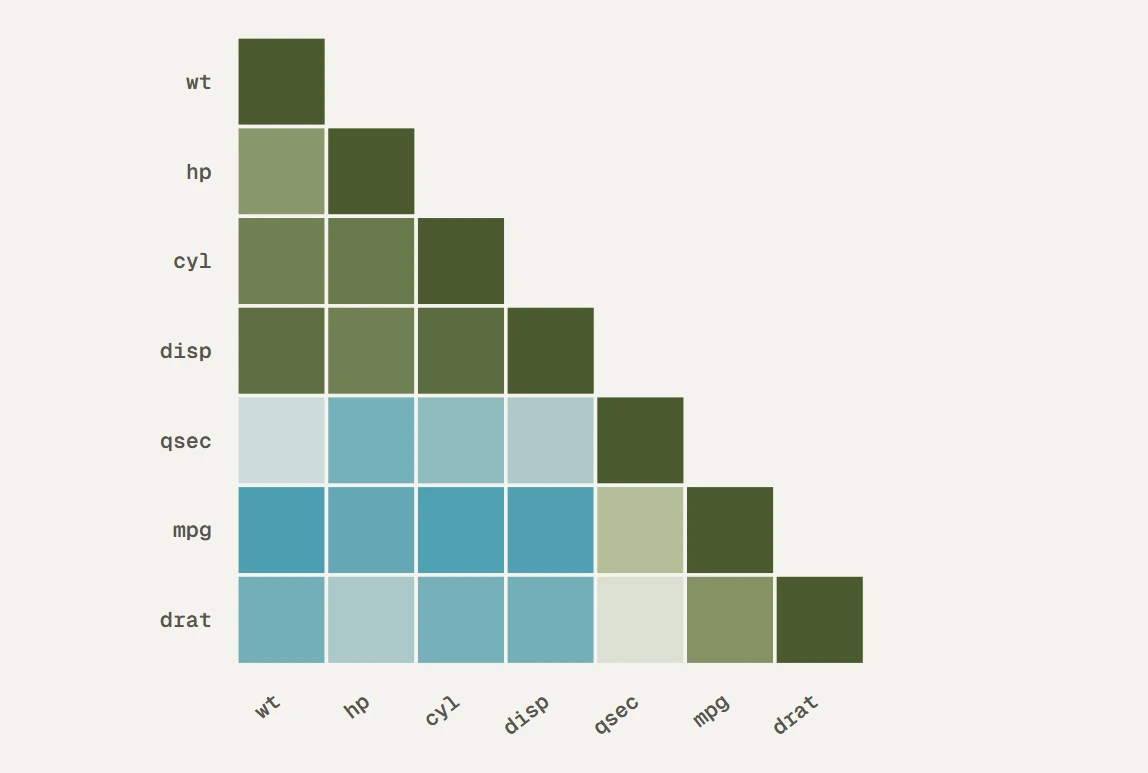 Correlation heatmap · walter_white
|
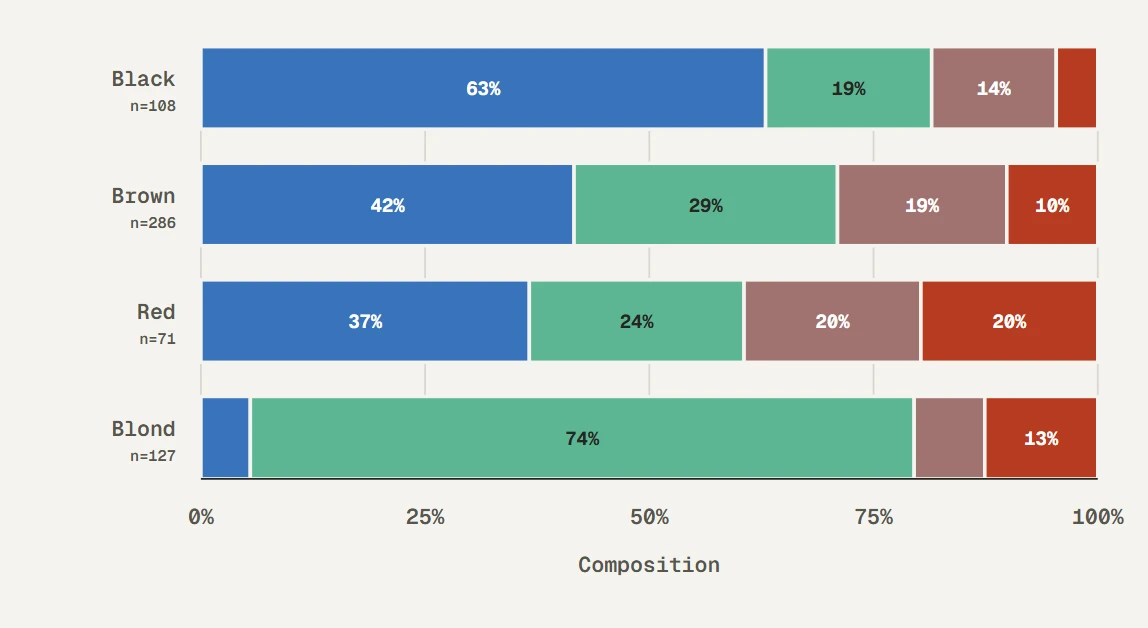 Eye color composition by hair color · lactate_steps
|
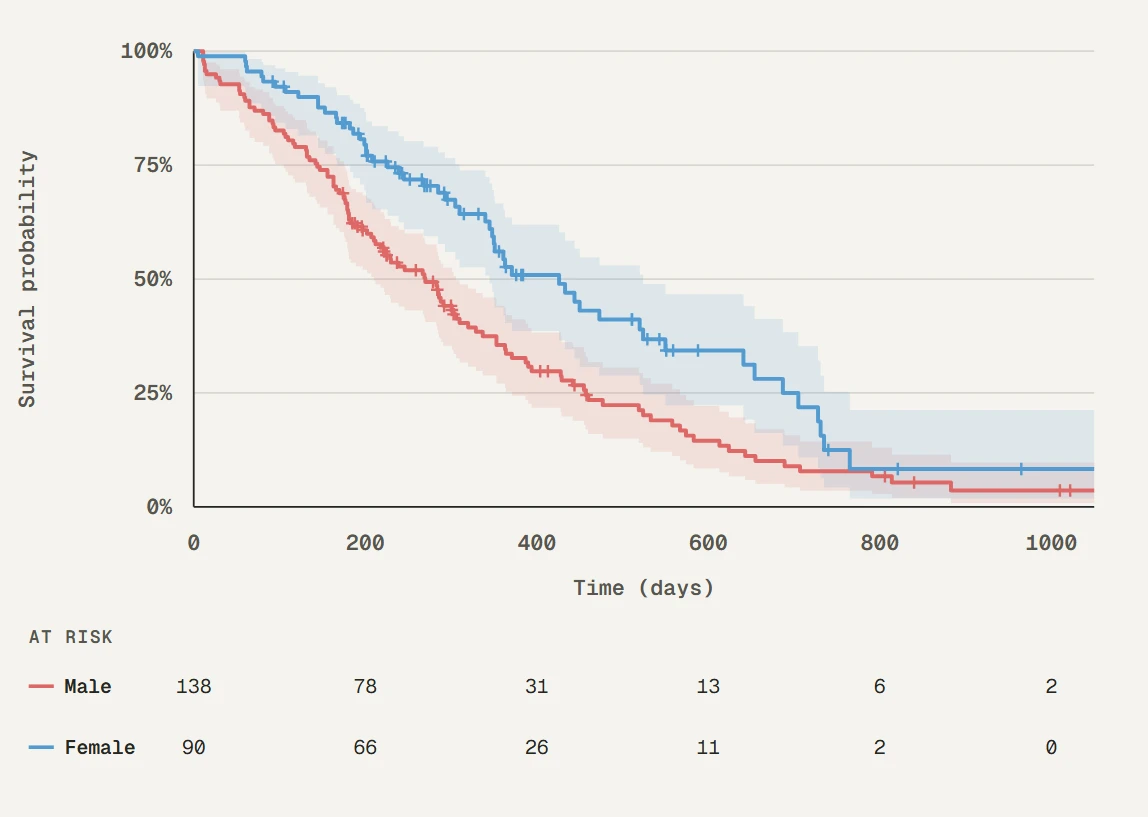 Kaplan–Meier survival curve · heat_light
|
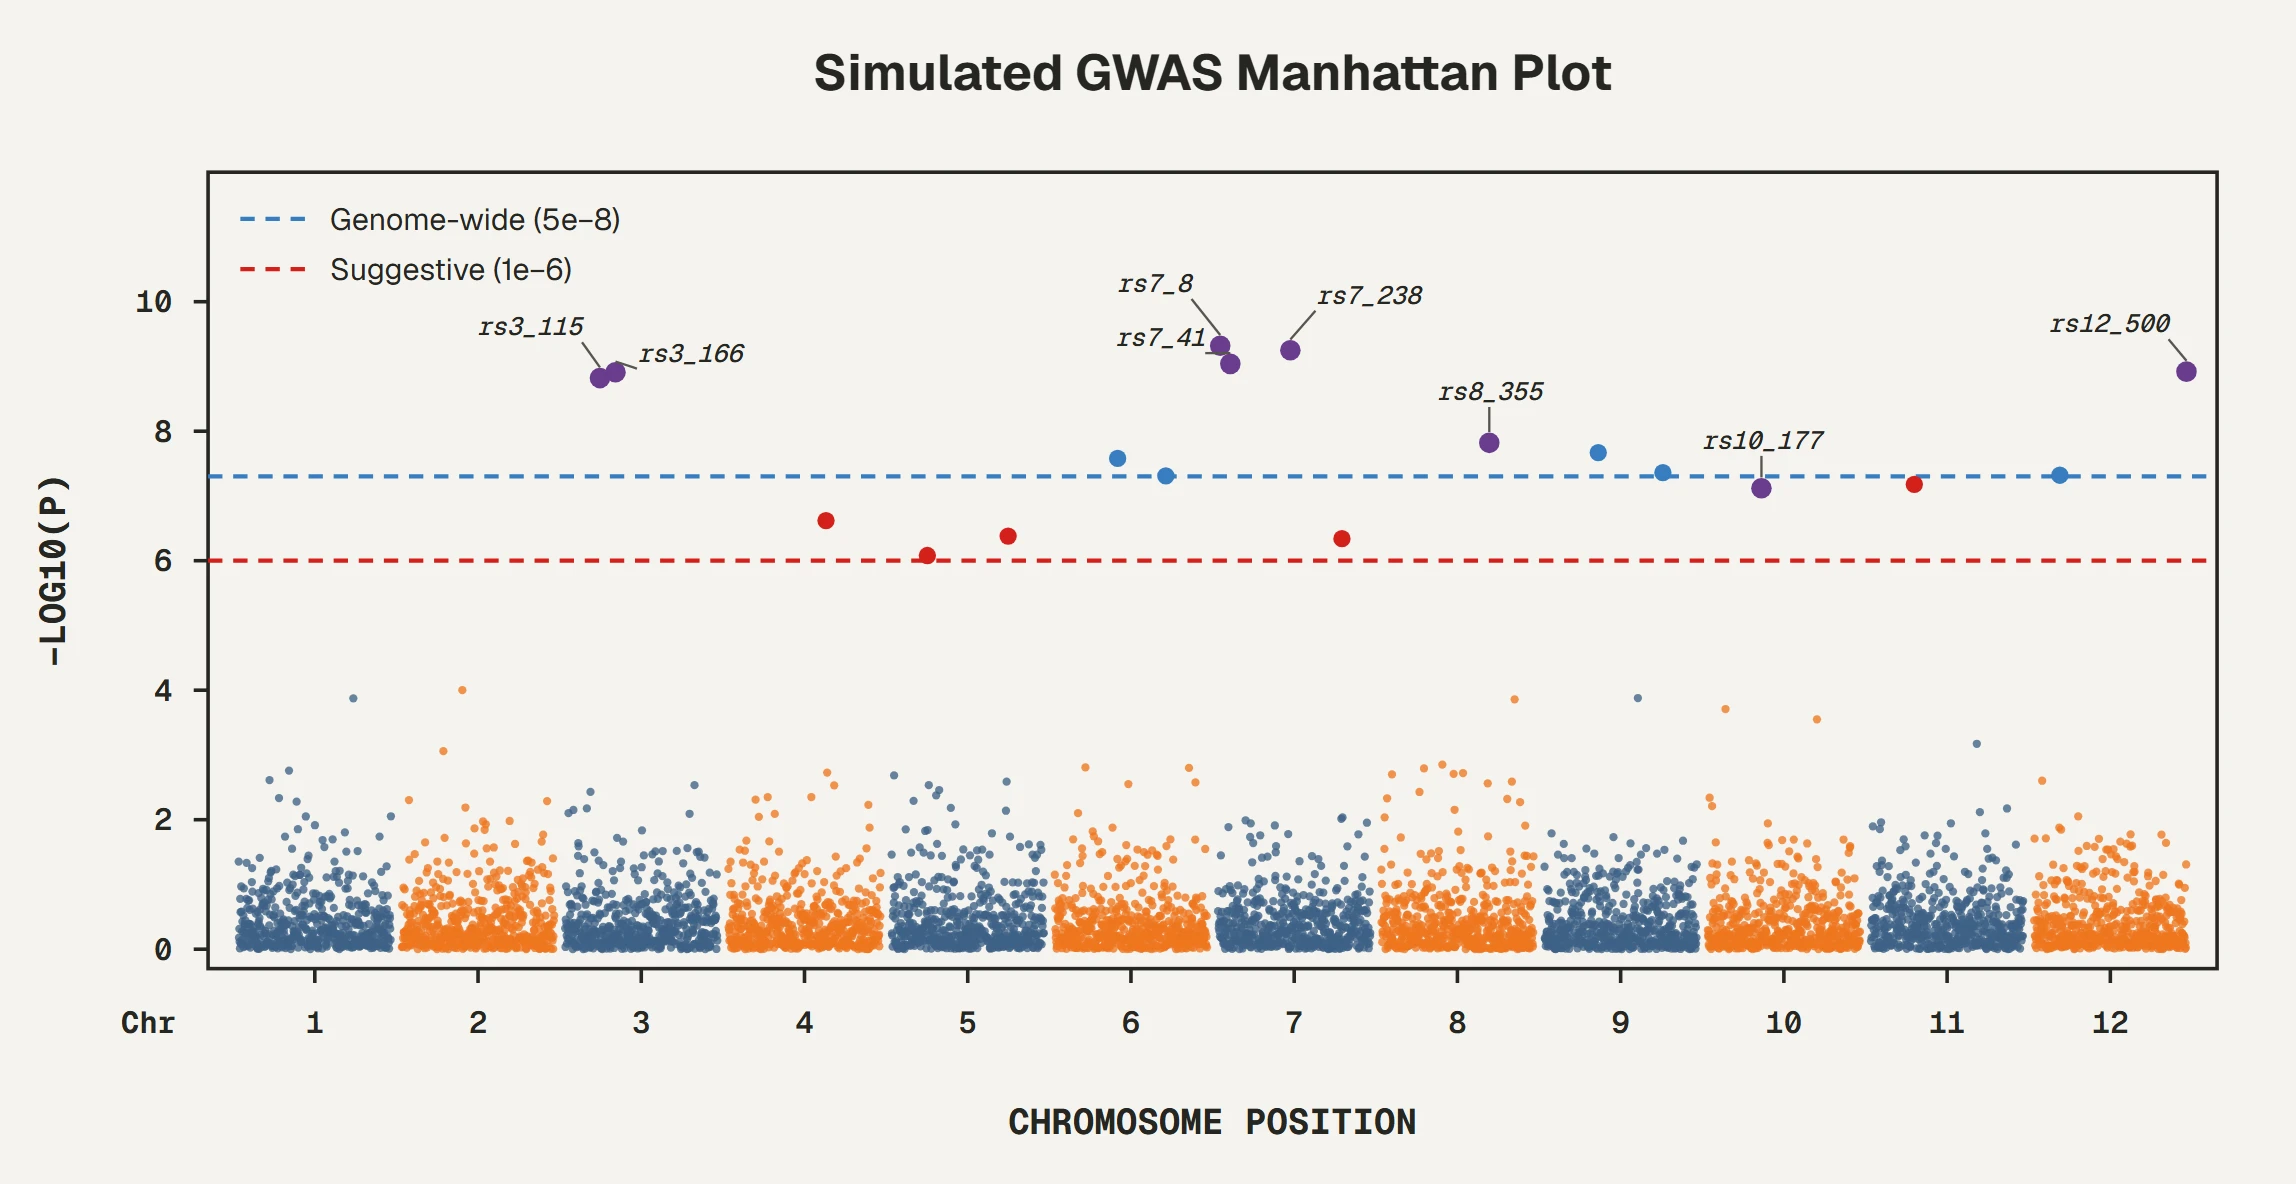 Manhattan plot · cancer_mosaic
|