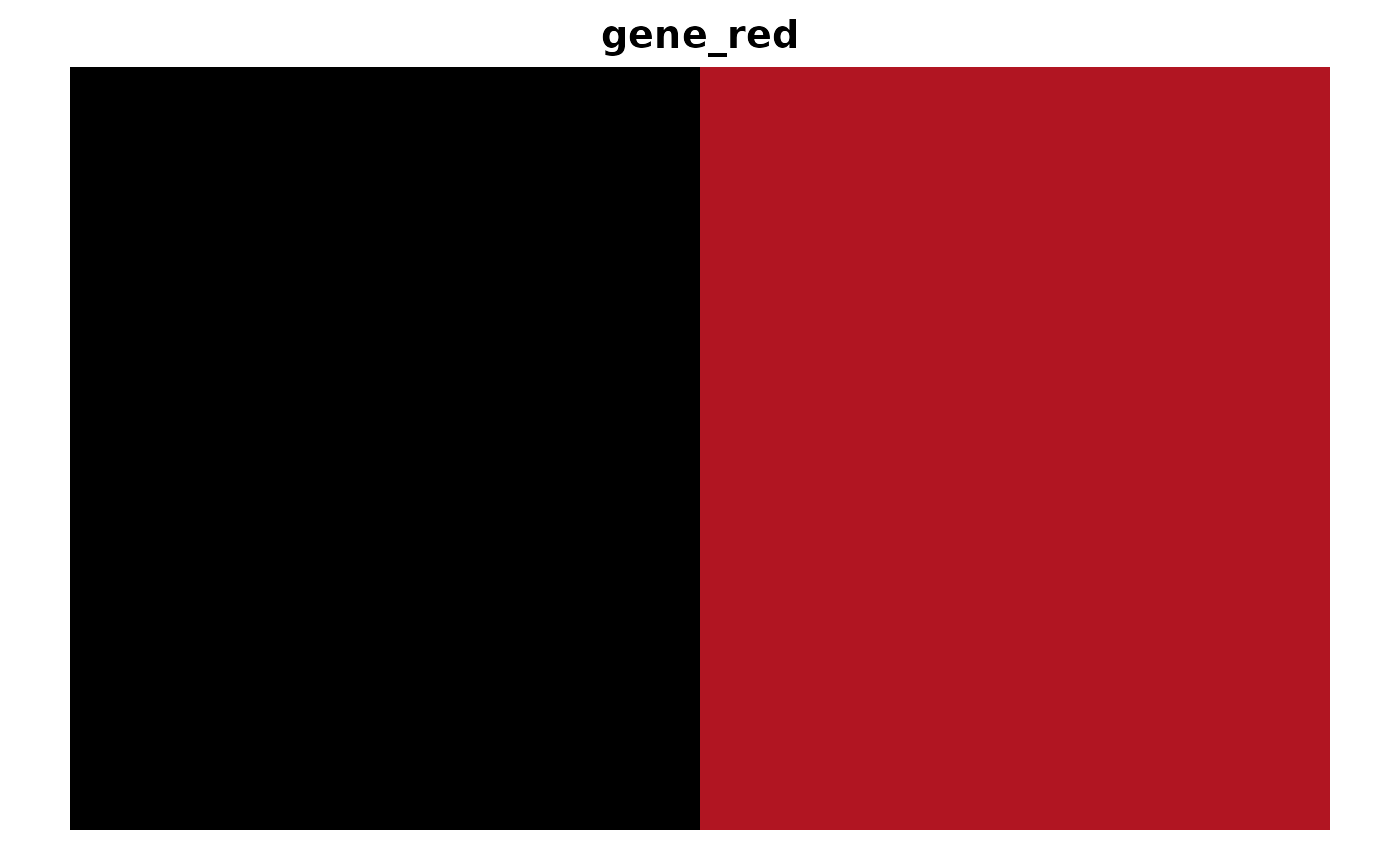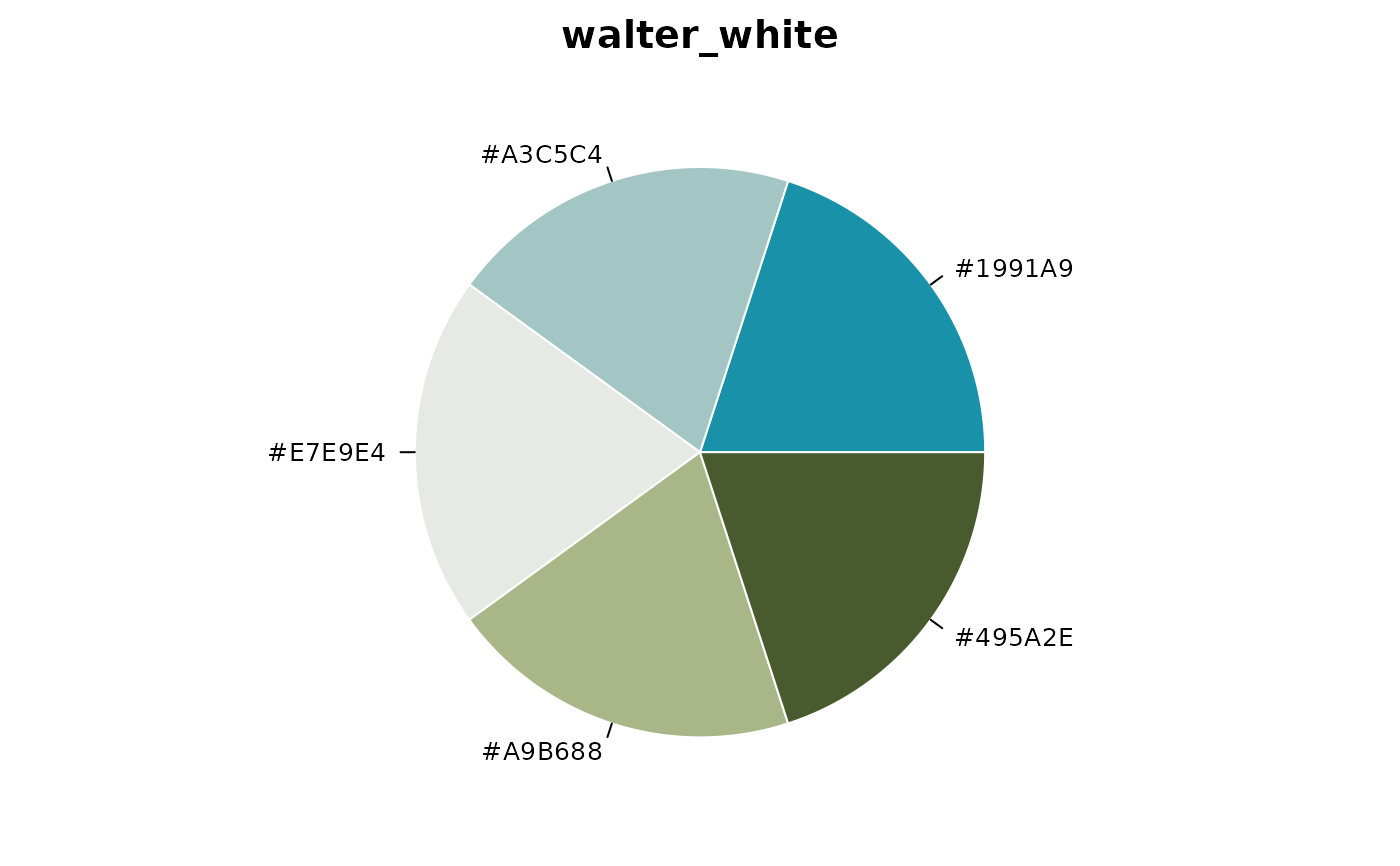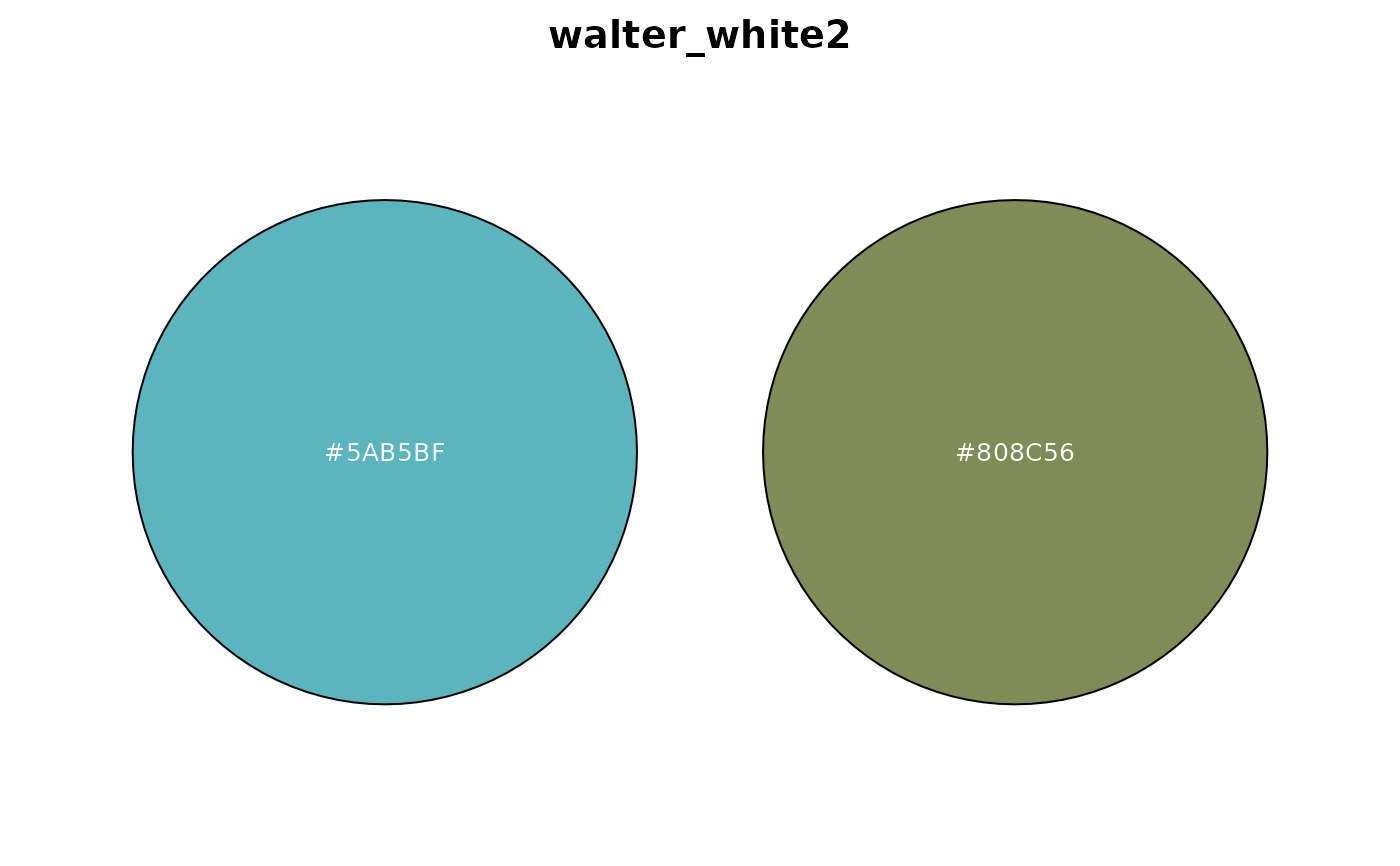
Visualize a palette using various plot styles.
Usage
preview_palette(
  name,
  type = NULL,
  n = NULL,
  reverse = FALSE,
  plot_type = c("bar", "pie", "point", "rect", "circle"),
  title = NULL,
  palettes_dir = NULL
)
Arguments
- name
Character. Name of the palette.
- type
Character. One of "sequential", "diverging", "qualitative". If NULL, auto-detected.
- n
Integer. Number of colors to use. If NULL, uses all. Default: NULL.
- reverse
Logical. Reverse the palette before
nis applied. Passed straight through toget_palette(). Default: FALSE.- plot_type
Character. One of "bar", "pie", "point", "rect", "circle". Default: "bar".
- title
Character. Plot title. If NULL, defaults to palette name.
- palettes_dir
Character. Directory holding a palette collection (
sequential/,diverging/,qualitative/subdirectories of JSON files). If NULL, the palettes bundled with the package are used.
Value
NULL, invisibly. Called for its plotting side effect — the return
shape is the same for every plot_type.
Details
"bar", "pie", "point" and "circle" are drawn with base graphics;
"rect" is drawn with ggplot2. Either way the plot goes straight to the
active device and nothing is returned — use palette_gallery() when you
want plot objects you can modify, arrange or save.
See also
palette_gallery(), which returns ggplot objects instead of drawing.