Visualize a palette using various plot styles.
Usage
preview_palette(
name,
type = NULL,
n = NULL,
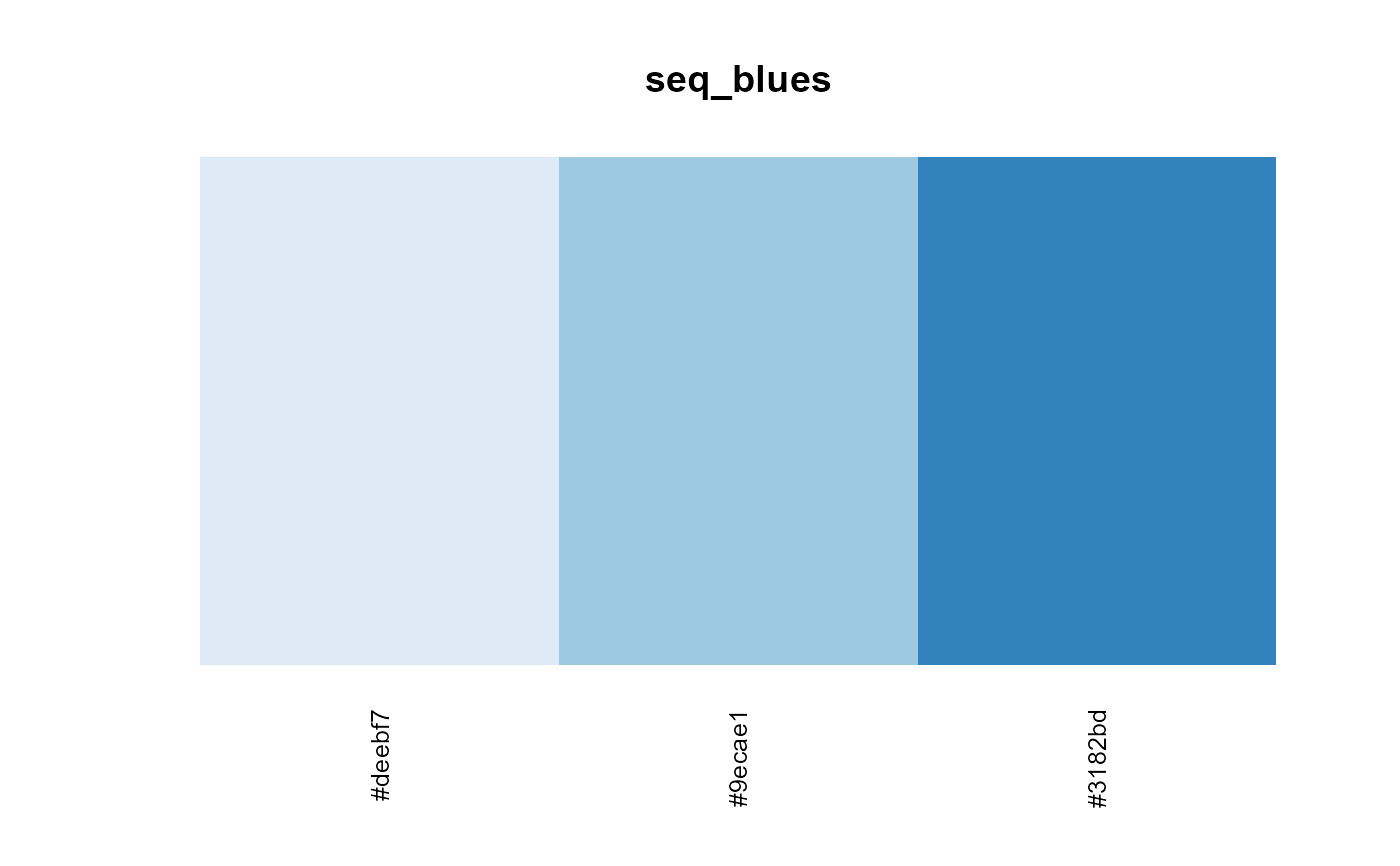
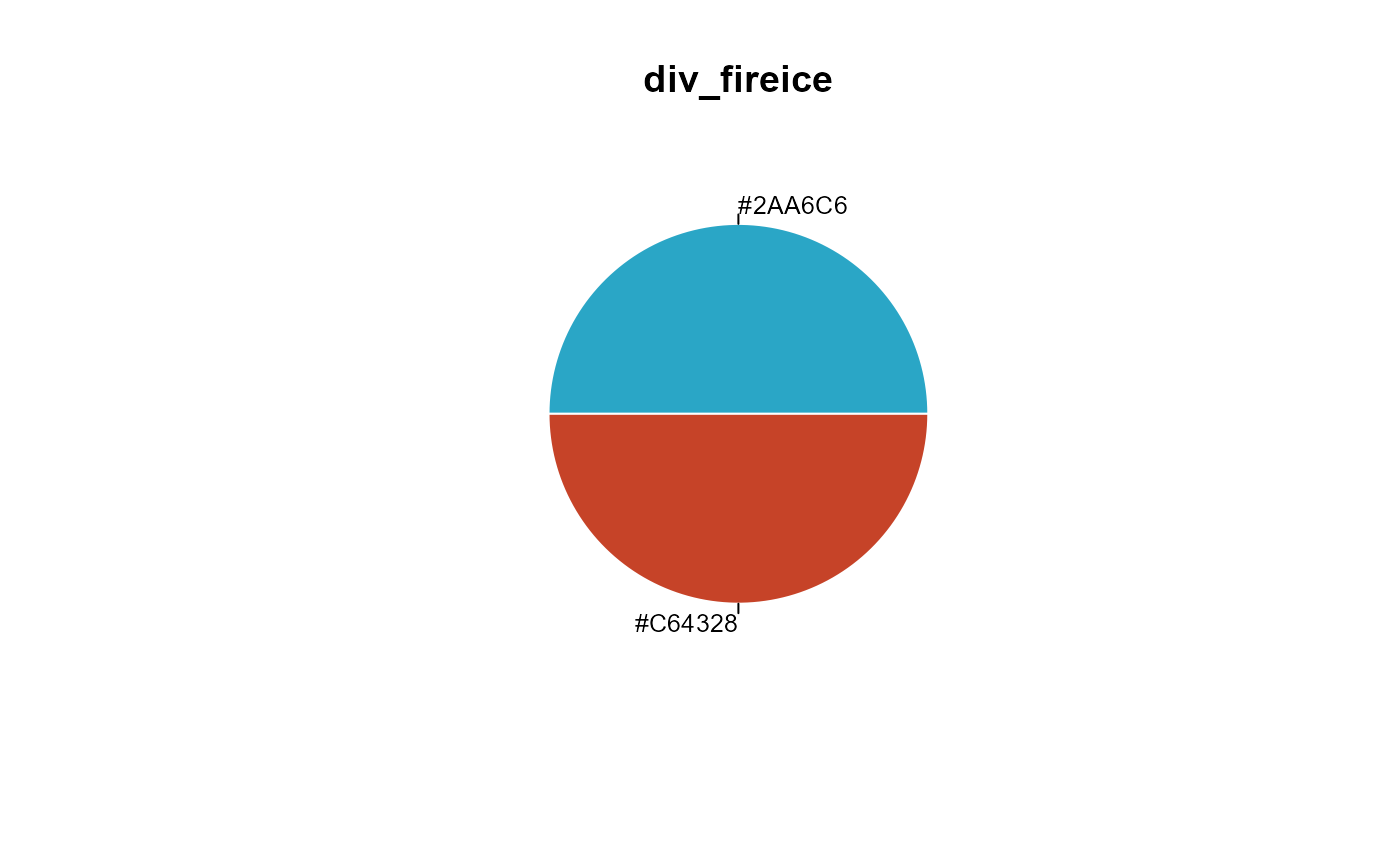
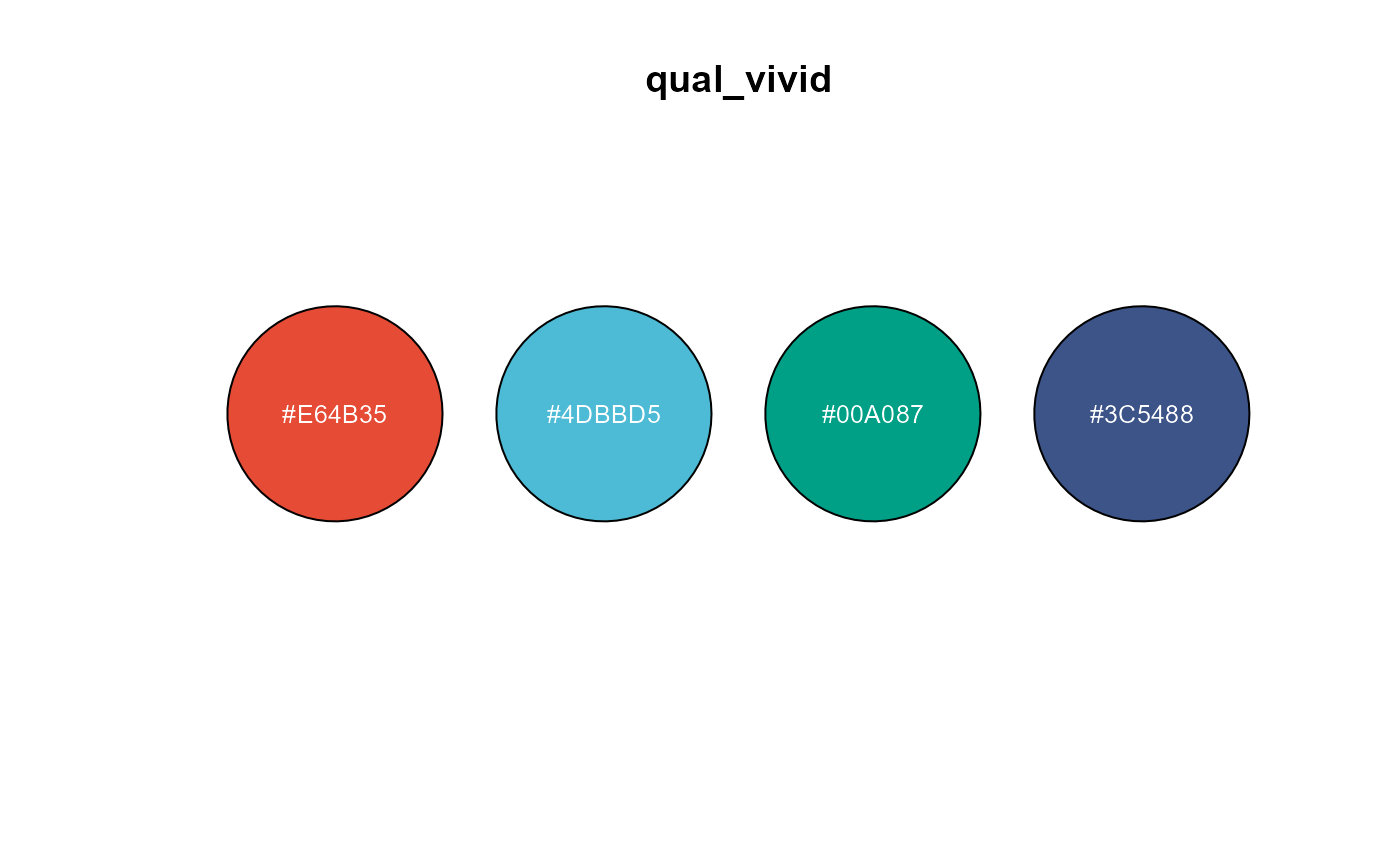
plot_type = c("bar", "pie", "point", "rect", "circle"),
title = NULL,
palettes_path = NULL
)Arguments
- name
Character. Name of the palette.
- type
Character. One of "sequential", "diverging", "qualitative". If NULL, auto-detected.
- n
Integer. Number of colors to use. If NULL, uses all. Default: NULL.
- plot_type
Character. One of "bar", "pie", "point", "rect", "circle". Default: "bar".
- title
Character. Plot title. If NULL, defaults to palette name.
- palettes_path
Character. Path to a
palettes.rdafile. If NULL, uses the installed package dataset.